Steam Engine - Indicator Diagram Of Steam Engine
What is Indicator Diagram Of Steam Engine?
Indicator diagram of steam engine is nothing but a graphical representation which defines with variation in pressure and volume of steam inside the engine cylinder denotes with pv diagram. Working on steam engine, indicator diagram is plotted by the modified Rankin cycle.Before developing the indicator diagram of steam engine, we should consider the following points.It will help to understand the indicator diagram.
1. The steam enters in boiler pressure and released at condenser pressure. 2. The opening and closing steam ports are instantaneous. 3. Steam is hyperbolic at the time of expansion or compression which is pv=c. 4. Steam pressure remains constant at the time of condensation and no wire drawing due to restricted valve opening. 5. The expansion and compression of steam is hyperbolic nature (pv=c).
But practically all the above points are not possible. so theoretical indicator diagram of steam engine is slightly different from actual indicator diagram.
Theoritical or Hypothetical Indicator Diagram Of Steam Engine
Theoretical indicator diagram or hypothetical indicator diagram is defined by the modified Rankin cycle define by pressure-volume curve. We can see, there is no pressure in the engine cylinder, so clearance is zero but practically it is impossible, shown in the line diagram.

1.1st case point 1-2:-
At a point 1 position, steam enters to the engine cylinder through inlet ports at a constant pressure and piston moves towards the right direction.After that, steam is cut-off at point 2 position, is called cut-off point.
2.2nd case point 2-3:-
Point 2 position steam expand hyperbolically (pv=c)in the engine cylinder and piston reach at dead end but pressure falls.
3.3rd case point 3-4:-
At point 3, inlet steam is released from engine through exhaust ports.As a result pressure in the engine cylinder falls down suddenly without change in volume.So this point is called a release point.
4.4th case point 4-5:-
At the point 4 position, piston starts to move in opposite direction and used steam is released through exhaust ports at constant pressure till the Port is closed.At this point steam pressure is called back pressure.
5.5th case point 5-1:-
At the point 5 position, inlet ports are open and some steam enters to the engine cylinder without change in volume which increases the steam pressure and again piston moves towards the right position. this process continues till the original position is restored.
Actual Indicator Diagram Of steam Engine
Actual indicator diagram of steam engine is different from the theoretical indicator diagram.In the picture shown below, drawn with firm line shows the actual indicator diagram and dotted line show the theoretical indicator diagram.
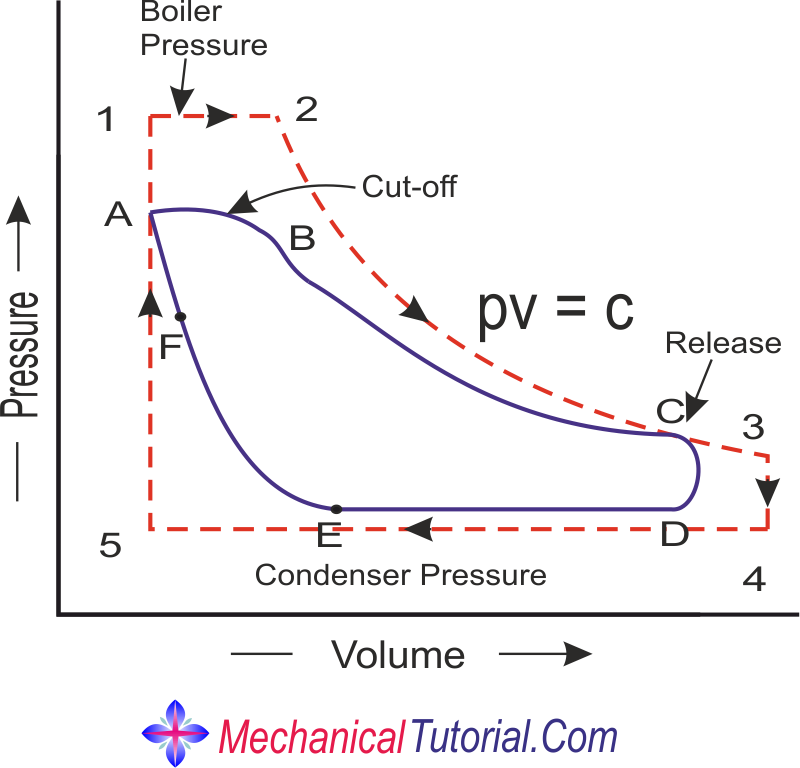
1. When steam enters from boiler to Indian cylinder there is some pressure drop at the steam.That's why, at the beginning of the stroke is less than the boiler pressure. 2. due to the air drawing through the steam ports,forward stroke of the piston is always slightly fallen in pressure shown by the line AB.
Diagram Factor Of steam Engine
Diagram factor(K) is the ratio of the area of actual indicator diagram to the area of theoritical or hypothetical indicator diagram.The average value of diagram factor lies between 0.65 to 0.9
Indicator factor defines by the work done per stroke ,
Work done per stroke also known as,

Actual work done per stroke is,

theoritical work done per stroke is,

So,the diagram factor is the ratio of actual mean effective pressure to the theoritical mean effective pressure.